Processing FTIR data
FTIR data
FTIR data are stored as a JCAMP-DX file wich contains all datapoints and measurement parameters in a ASCII format.
A FTIR dataset in opened by simply dragging and dropping the data file into Mnova.
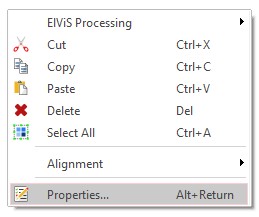
The first time you open a FTIR data file you have to set the display properties. Right click in the spectral window and select 'Properties'
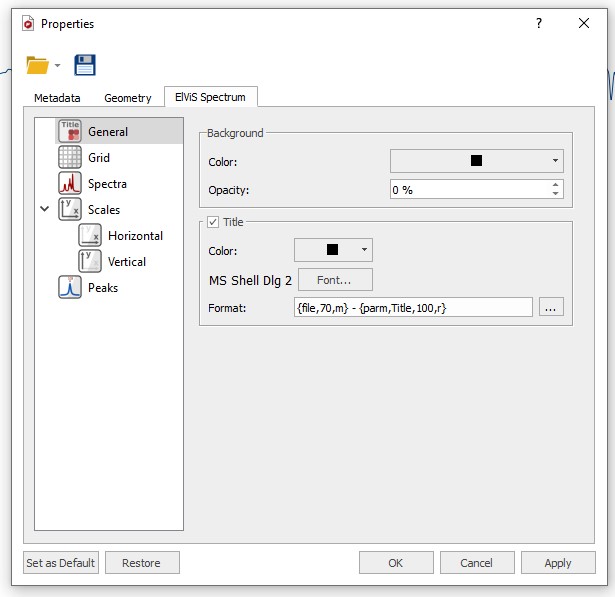
Download the FTIR Spectrum Properties file located here and load in into MestreNova using the 'Folder' symbol at the top of the 'Properties' Window. After loading the file click the 'Apply' and 'Set as Default' buttons at the bottom of the 'Properties' window followed by 'OK'.
Before interpreting the spectrum you should execute the following manipulations:
Zoom in/out
While processing and interpreting your spectrum it is sometimes neccesary to zoom in to specific spectral regions or peaks. All magnification functions can be found in the 'View'ribbon
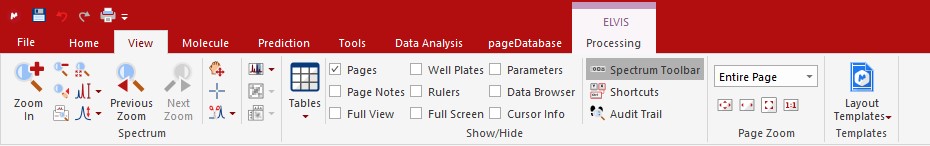
The zoom functions can also be accessed via keyboard short-cuts; 'Zoom In' (z), 'Zoom Out' (shift + z), 'Full Spectrum'(f). Besides the short-cuts, the 'Spectrum Toolbar' from the 'View' ribbon also adds the most used magnification buttons to the right hand side of the screen for easy access. In order to zoom in the vertial direction simply use the scroll wheel of your mouse.
Peak Picking
To annotate all interesting peaks select 'Manual Threshold’ from 'Peaks' group in the ‘ELVIS Processing’ ribbon.
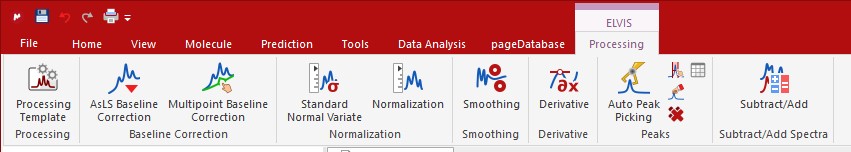
Now you can select different regions and height thresholds where peaks should be detected. Single peaks can be picked using the 'Peak by Peak' button from the 'Peaks' group. The automatic peak picking option usually picks way to many points making your spectal image very crowded and unclear.
Baseline Correction
Ideally the baseline of an infrared spectrum is flat over the whole spectral width. The spectrum of a transmission measurement may drop off at the left (%T display) if the sample has a rough surface or contains inorganic compound powder. This is caused by scattering of the infrared light at the sample surface or interior, and this effect is greater for the shorter wavelength. Consequently, an IR spectrum affected by scattering drops more (%T display) towards the short wavelength (high wavenumber) end. MNova can correct this shift in baseline to some degree by fitting a high order polynomial curve to the baseline and substracting this curve from the data.
Baseline correcting can be applied by clicking the 'AsLS Baseline Correction' button in the ‘ELVIS Processing’ ribbon.