Area A (3800 - 3200 cm-1)
Area A
The largest peaks in this Area are due to the O―H stretches of alcohols (including phenols) and carboxylic acids, the N―H stretches of amines and amides, and the C―H stretches of terminal alkynes.
- Neat alcohols usually show a very strong and broad band between 3500 cm-1 and 3100 cm-1. The broadness of this band is due to hydrogen bonding between molecules (intermolecular hydrogen bonds). For alcohols that are unable to form hydrogen bonds (due to steric hindrance for example) or for alcohols in very dilute solutions, the band sharpens to a peak at 3600 cm-1. An intramolecularly hydrogen-bonded alcohol can lead to broad bands from 3400 cm-1 down to 2500 cm-1. This band does not sharpen upon dilution of the alcohol.
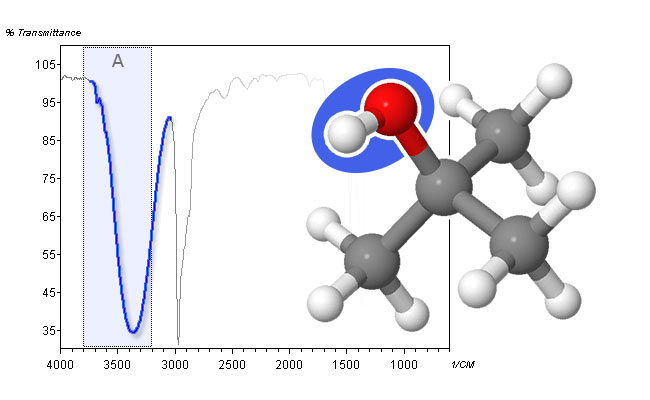
spectrum and molecular structure of t-butanol - The O―H stretch in carboxylic acids leads to even broader peaks than for alcohols. It can range from 3500 cm-1 down to 2500 cm-1, thereby obscuring C―H stretching peaks in Area B. This is mainly due to the formation of relatively stable dimers. In dilute solutions, a sharp peak between 3550 cm-1 and 3500 cm-1 can be observed.
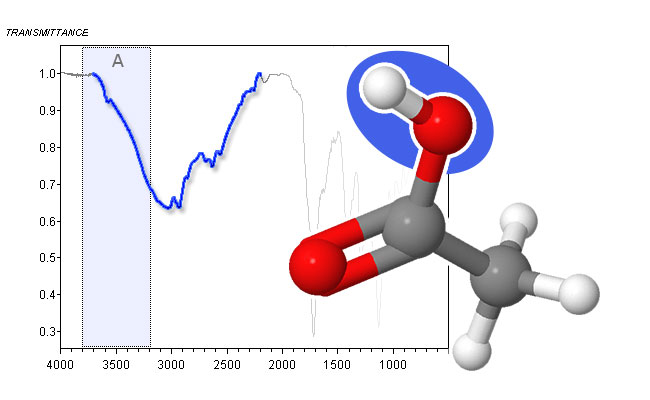
spectrum and molecular structure of acetic acid - Primary amines (R-NH2) show two bands between 3460 cm-1 and 3280 cm-1. These are due to the asymmetric and symmetric stretch of the two N―H bonds. The bands are usually sharper, but weaker than the O―H stretch absorption of alcohols.
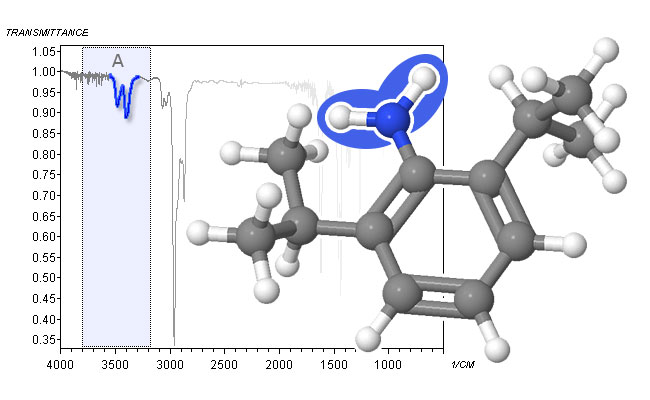
spectrum and molecular structure of 2,6-diisopropylaniline - Secondary amines (R-NH-R’) only show a single absorption between 3350 cm-1 and 3300 cm-1. This band is again weaker and sharper than the O―H stretch peak of alcohols.

spectrum and molecular structure of piperidine - Primary amides R-C(O)-NH2 show a similar pattern as primary amines, albeit at slightly higher frequencies (a peak between 3540 cm-1 and 3520 cm-1 and one between 3400 cm-1 and 3380 cm-1) in solution. In the solid state, the peaks shift down to 3360 cm-1 – 3340 cm-1 and 3200 cm-1 – 3180 cm-1, respectively. The peaks are generally more intense than the ones for primary amines.
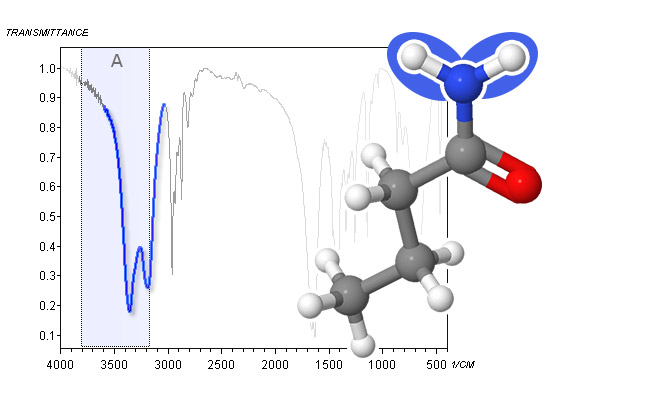
spectrum and molecular structure of n-butyramide - Secondary amides (R-C(O)-NH-R, like secondary amines, have a single peak between 3440 cm-1 and 3420 cm-1 in dilute solution, which shifts down to 3300 cm-1 – 3280 cm-1 in the neat liquid or in the solid state. Again, the amide peak is generally stronger than its amine counterpart and can have some structure.
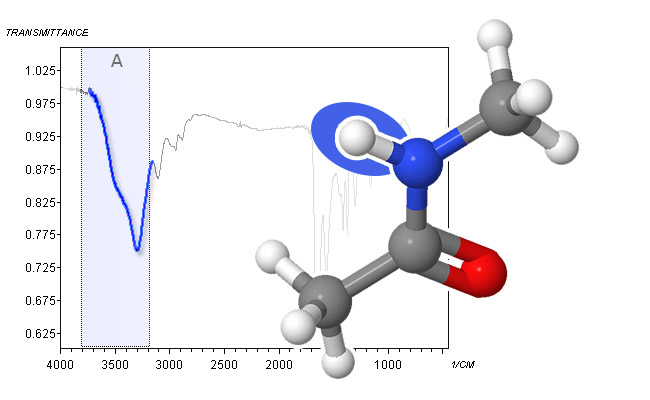
spectrum and molecular structure of N-methylacetamide - The C―H stretch of terminal alkynes at around 3300 cm-1 is the final absorption that can be observed in Area A. Because alkynes do not form hydrogen bonds, this peak is sharp.
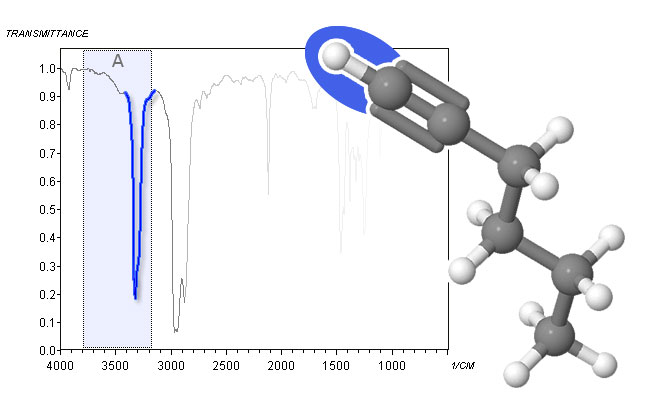
spectrum and molecular structure of 1-hexyne