plaatjemaken
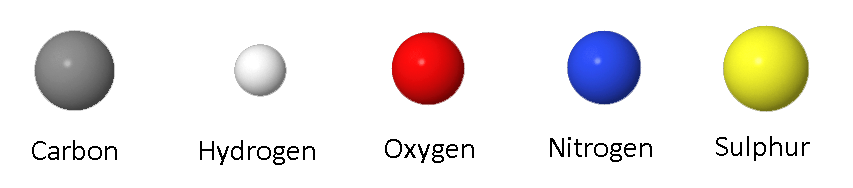
Incidentally, the differently coloured atoms in JSmol (and in regular figures in EduSpec) roughly follow the CPK coloring. Briefly, carbon atoms in JSmol are grey, hydrogens are white, oxygen is red, nitrogen is blue and sulphur is yellow.
JSpecView JavaScript component
The spectrum below is a JSpecView JavaScript component. EduSpec uses it in questions where you are asked to select a peak that corresponds to a certain functional group. The red lines at the top of the spectrum mark regions (normally peaks) that are selectable. When you move your mouse over the spectrum, the peak regions will be highlighted in grey. You can select a hightlighted peak by clicking with the left mouse button. In the component above, you will see the number in the box at the bottom left change as a result of selecting different peaks. In the rest of EduSpec, this box will normally be invisible, but the program uses the number to check which peak you have selected and, in questions, if it is a correct one (sometimes, several peaks can be correct!).
Connected JSmol and JSpecview JavaScript components
The JSmol and JSpecView components can be connected, such that clicking on a peak results in an animation of the corresponding molecular vibration. The reverse is of course not true, since a single atom or functional group can be involved in multiple vibrations, resulting in as many peaks. The two connected components will only be used in an explanatory context.
Z:\nmr-jdx\Chemical-Shift\Characteristic-values